

 MENU
The certified reference material BAM-F012 from the Federal Institute for Materials Research and Testing [Bundesanstalt für Materialforschung und -prüfung] is a glass-based multi-emitter fluorescence standard. When excited by UV light, the standard exhibits a characteristic pattern of narrow emission bands in the visible spectral range.
In this application example, we examine this pattern using our DIY spectrometer, verify the plausibility of the wavelength calibration, and explain the difference between a raw spectrum and a spectrally corrected intensity measurement.
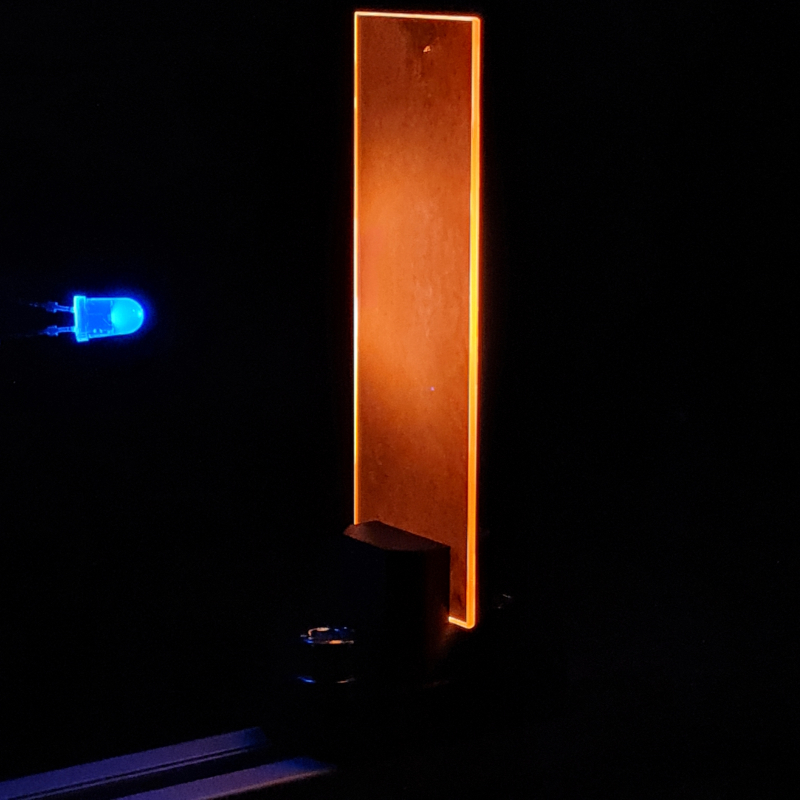
Fluorescence spectra are quick to record—but interpreting them correctly is more challenging than it seems at first glance. The spectrum of a fluorescent sample depends not only on the sample itself, but also on the excitation source, measurement geometry, optical filters, grating, optical fiber, detector, and the spectral sensitivity of the entire measurement system.
In a fluorescence measurement, a sample is excited by light of a shorter wavelength. After excitation, the sample emits light predominantly at longer wavelengths. The characteristic band positions of BAM-F012 provide reference points for verifying wavelength calibration. The intensities, on the other hand, also depend heavily on the measurement system.
That is why fluorescence spectrometers should be checked regularly. Aging lamps, dirty optics, changes in grating positions, varying detector sensitivities, or changes in filters can shift the measured spectrum or alter its shape. A reference material with a stable, well-defined emission pattern is therefore a practical benchmark for everyday use in the laboratory.
BAM-F012 is a certified reference material for fluorescence spectroscopy from the Federal Institute for Materials Research and Testing (BAM). Its development is based on joint research conducted by BAM, SCHOTT AG, and the University of Paderborn on glass-based fluorescence standards, which was carried out, among other things, as part of the BMBF-funded FLUOPLEX project. The resulting multi-emitter glass was comprehensively characterized by BAM and certified as reference material BAM-F012 in 2014.
It consists of a fluorescent multi-emitter glass that is available, among other things, in typical cuvette dimensions of approximately 12.5 mm × 12.5 mm × 40 mm. The glass is based on a lanthanum phosphate matrix and is doped with the rare-earth ions cerium(III), terbium(III), and europium(III). When excited by UV light, it produces a characteristic emission pattern with several relatively narrow bands in the visible spectral range.
The real highlight: For BAM-F012, it is not just the presence of these emission bands that is described. What is certified is a normalized relative intensity pattern consisting of eight characteristic bands or shoulders. The certified values were derived from spectrally corrected measurements using a defined 365 nm excitation and specified measurement conditions. This means that BAM-F012 is not just any fluorescent glass, but a tool for routine instrument testing and quality assurance.
The certified BAM-F012 values apply under defined conditions: excitation at 365.0 nm ± 0.5 nm using a continuous-wave source, defined bandwidths, 0°/90° measurement geometry, controlled polarization settings, and a temperature of 25 ± 2 °C. In addition, a correction for the spectral sensitivity of the emission channel is required.
For our measurement, we deliberately chose not to set up a sophisticated fluorescence measurement station. The goal was simply to conduct a quick, practical test: What does the BAM-F012 spectrum look like when measured with our DIY spectrometer, and what educational insights can we already draw from this, despite the simple setup?
The measurement was performed using a DIY spectrometer in a Czerny-Turner configuration with a focal length of 150 mm and a 300 lp/mm grating. Wavelength calibration was carried out pragmatically using three laser diodes at 405 nm, 520 nm, and 650 nm. Simple UV LEDs with different central wavelengths were then used for excitation without collimation. The fluorescence light was coupled into an optical fiber via one edge of the BAM-F012 slide. Shown here is the dark-field-corrected raw signal from the sensor without spectral sensitivity correction.
For the first measurement, BAM-F012 was excited using a UV LED with a nominal wavelength of 365 nm. This means that the excitation is nominally close to the wavelength of 365.0 nm ± 0.5 nm used for certification. However, the LED does not replace the spectrally defined excitation with a 4 nm bandpass used in that test: its actual emission maximum and spectral bandwidth were not determined for this measurement. Furthermore, the measurement was performed freehand without a defined measurement geometry and without spectral sensitivity correction. The spectrum shown therefore illustrates the characteristic emission pattern of BAM-F012; its relative band intensities should not be equated with the certified values.
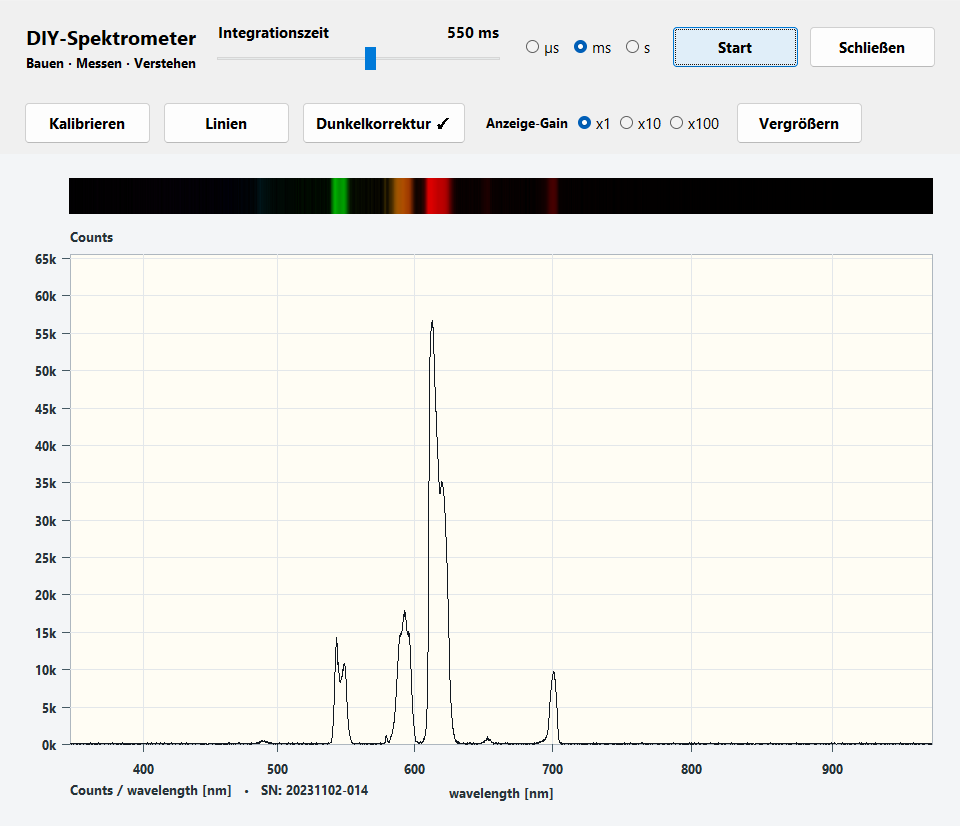
Quick-and-dirty image of the BAM-F012 slide illuminated by a 365 nm LED. The image shows dark-signal-corrected raw data without spectral correction.
The BAM documents identify eight characteristic emission bands or shoulders. In the first image, most of them are already clearly visible. The intensity ratios should be understood as the raw signal from the entire measurement system.
Despite this simple setup, the characteristic emission bands of BAM-F012 are clearly visible. The green and red bands around approximately 542 nm, 591 nm, 612 nm, 620 nm, and 701 nm are particularly striking. This allows the typical pattern of the reference material to be impressively reproduced even in a very simple measurement setup.
| Band according to BAM-F012 |
Assignment according to BAM |
Observation | Comment |
|---|---|---|---|
| 488 nm | Tb³⁺ | very weak / barely visible |
Origin uncertain due to edge geometry and system sensitivity in the blue-green range. |
| 542 nm | Tb³⁺ | clearly visible | Green terbium band, clearly visible in the screenshot. |
| 548 nm Shoulder | Tb³⁺ | faintly discernible | Visible as a shoulder or double structure in the green spectral region. |
| 591 nm | Tb³⁺ / Eu³⁺ | clearly visible | Transition between the green and red emission ranges. |
| 612 nm | Eu³⁺ | very strong | The dominant red peak in the image; ideal as a visible anchor in the spectrum. |
| 620 nm Shoulder | Tb³⁺ | clearly visible | Shoulder to the right of the strong 612 nm peak. |
| 653 nm | Eu³⁺ | weak | Only slightly visible; sufficient for demonstration purposes, but needs to be optimized later for quantitative analysis. |
| 701 nm | Eu³⁺ | clearly visible | A distinct peak in the deep-red region; visible in the expected spectral range |
Even with a simple LED and without a collimated beam, the slide exhibits several distinct emission bands. This makes the BAM-F012 ideal as a visual demonstration object for fluorescence spectroscopy and as a practical daily check for the measurement setup under reproducible geometry and constant measurement conditions.
The characteristic bands at approximately 542 nm, 591 nm, 612 nm, and 701 nm appear in the spectrum at the expected positions. For a DIY spectrometer calibrated using only three laser diodes, this is a gratifyingly convincing initial test.
The spectrum shown is a raw spectrum. It includes not only the emission from the BAM-F012 glass but also the wavelength-dependent sensitivity of the grating, optics, fiber, and sensor. In addition, the excitation wavelength, LED spectrum, sample geometry, and coupling affect the relative peak intensities.
Many beginners expect that a measured spectrum is automatically the objective spectrum of the sample. BAM-F012 elegantly demonstrates that spectroscopy is always also about understanding the measurement system: peak positions, peak intensities, linearity, and spectral correction are different aspects of the same measurement.
In addition to the spectrum already shown using a 365 nm LED, we recorded further spectra at other wavelengths (254, 385, and 395 nm). The spectra reveal distinct differences in the relative intensities of the emission bands. Particularly striking is the green band group around 542/548 nm: When excited at 254 nm, it is strongly pronounced relative to the dominant red band at 612 nm. At 365 nm, it remains clearly visible but recedes relative to the main red band. At 385 nm and 395 nm, the green band group is barely discernible at the selected display scale; here, the red emission structures dominate. The band around 488 nm also stands out more clearly with 254 nm excitation.
The observations illustrate that the choice of excitation source can influence the measured emission pattern. The various luminescent centers in the multi-emitter glass are excited to varying degrees depending on the excitation wavelength. An LED is not a monochromatic source: in addition to its nominal wavelength, the spectral bandwidth and the actual position of its emission maximum also influence the excitation.
These measurements serve as a qualitative demonstration. They were performed freehand with varying excitation and collection geometries and different integration times. The spectra shown are dark-signal-corrected but have not been corrected for the wavelength-dependent sensitivity of the measurement system. The observed differences therefore cannot be attributed solely to the excitation wavelength; geometry and optical coupling can also affect the relative band intensities. These measurements do not permit a quantitative comparison of excitation efficiencies or a quantitative comparison with the certified intensity ratios.
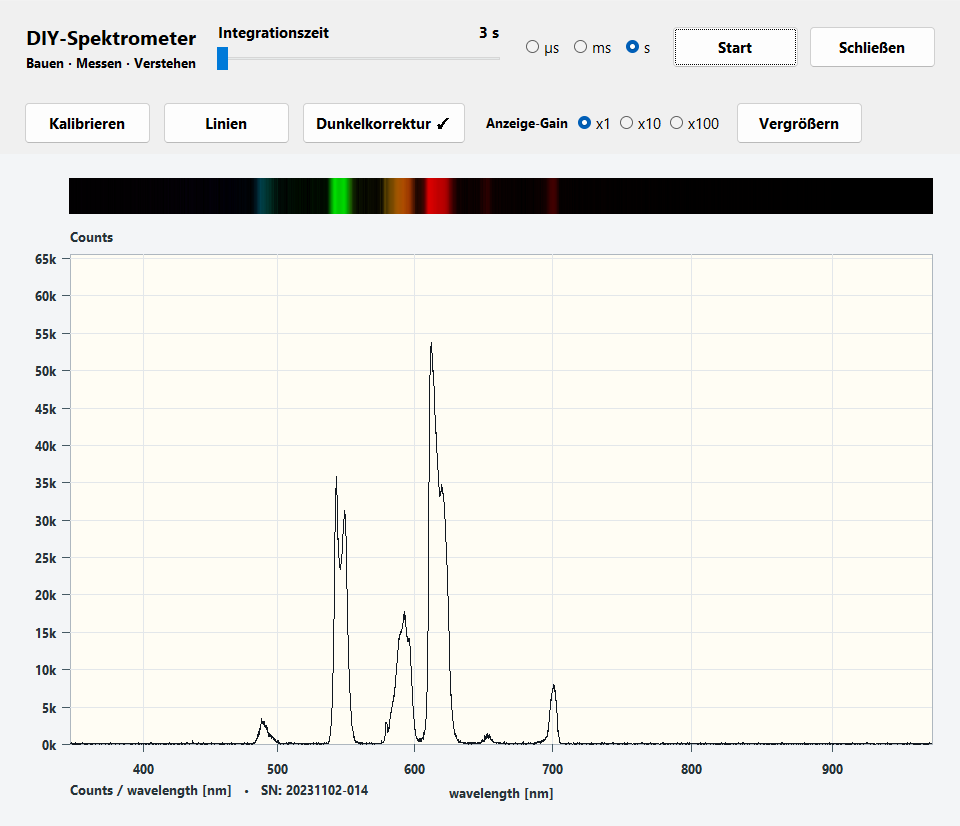
BAM-F012 excited by a 254 nm LED
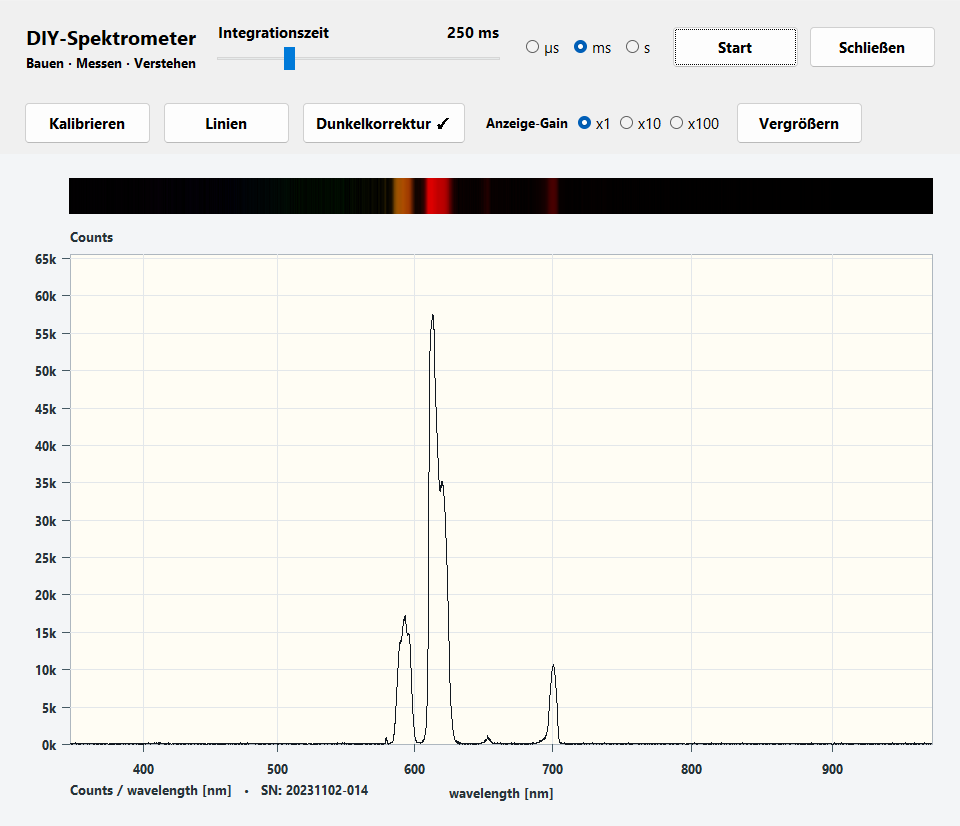
BAM-F012 excited by a 385 nm LED
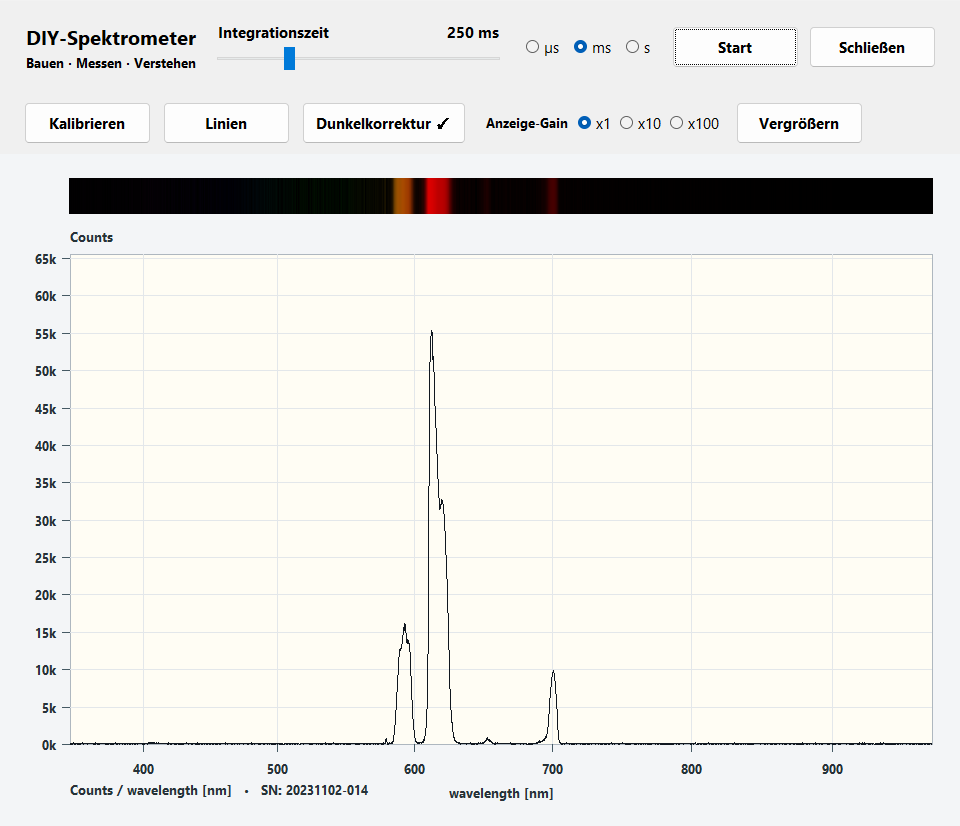
BAM-F012 excited by a 395 nm LED
Our experiment demonstrates the wide range of educational applications for the BAM-F012: Its distinctive emission pattern makes fluorescence easy to understand and is well-suited for reviewing the wavelength scale as well as for discussing calibration, spectral sensitivity, and measurement conditions.
However, for many educational applications, the certified standard is too expensive. Eureca is therefore currently working with the Federal Institute for Materials Research and Testing (BAM) on a more affordable new version of a fluorescence standard designed specifically for use in lab classes. The goal is to make such experiments more accessible for educational purposes. If you're interested in this standard, please feel free to contact us!
Here you can easily ask a question or inquiry about our products:
Last update: 2026-10-14

EURECA Messtechnik GmbH
Deutz-Kalker Straße 35, D-50679 Köln

 Phone: +49 (0)221 952629-0
Fax: +49 (0)221 952629-9
info(at)eureca.de
www.eureca.de


